Displays a bar graph in a cell
Displays a horizontal bar graph in a cell.
caution
This function uses the IMAGE function.
The IMAGE function is currently available to those who participate in the Office Insider program.
URL
https://api.excelapi.org/graph/sparkline_bar
Configuration
| Configuration | Required | Description |
|---|---|---|
| value | ✔ | Specify a value. |
| max | Specifies the maximum value. If not specified, it is 100. | |
| fromcolor | Specifies the color of the left edge of the gradient. Specify in HEX format without #. If not specified, it is 0000ff (blue). | |
| tocolor | Specifies the color of the right edge of the gradient. Specify in HEX format without #. If not specified, it is 0000ff (blue). |
Example (single color)
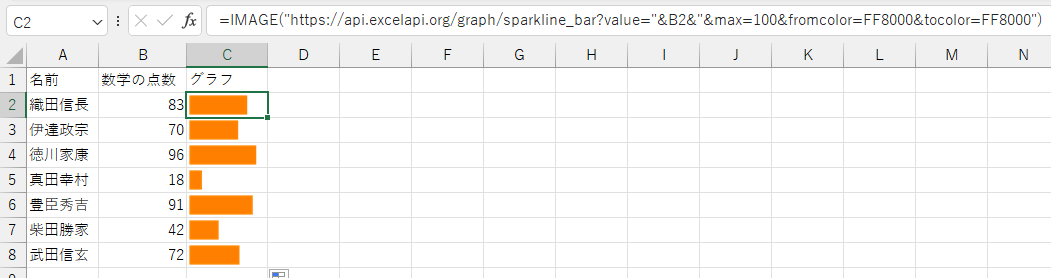
C2:
=IMAGE("https://api.excelapi.org/graph/sparkline_bar?value="&B2&"&max=100&fromcolor=FF8000&tocolor=FF8000",,1)
Example (gradation of specified color)
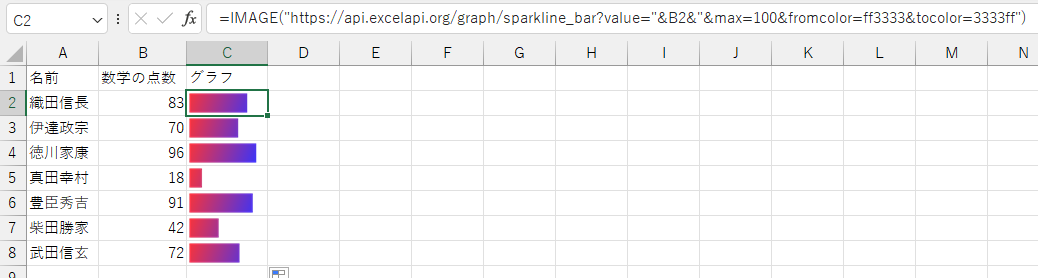
C2:
=IMAGE("https://api.excelapi.org/graph/sparkline_bar?value="&B2&"&max=100&fromcolor=ff3333&tocolor=3333ff",,1)
info
Please refer to the following sites and others for how to specify colors.
https://www.rapidtables.com/web/color/RGB_Color.html